
Dashboards & sprints
The detail matters. So does the whole.
Use dashboards, chart views and sprint planning to understand project status and organize your team’s next delivery cycle.

A CLOSER LOOK
Make space for
your next step.
Use dashboards, chart views and sprint planning to understand project status and organize your team’s next delivery cycle.
See what is moving.
Use a board’s Chart view to understand the distribution of work. Review statuses and groups before deciding where the team needs to focus.
Read the guide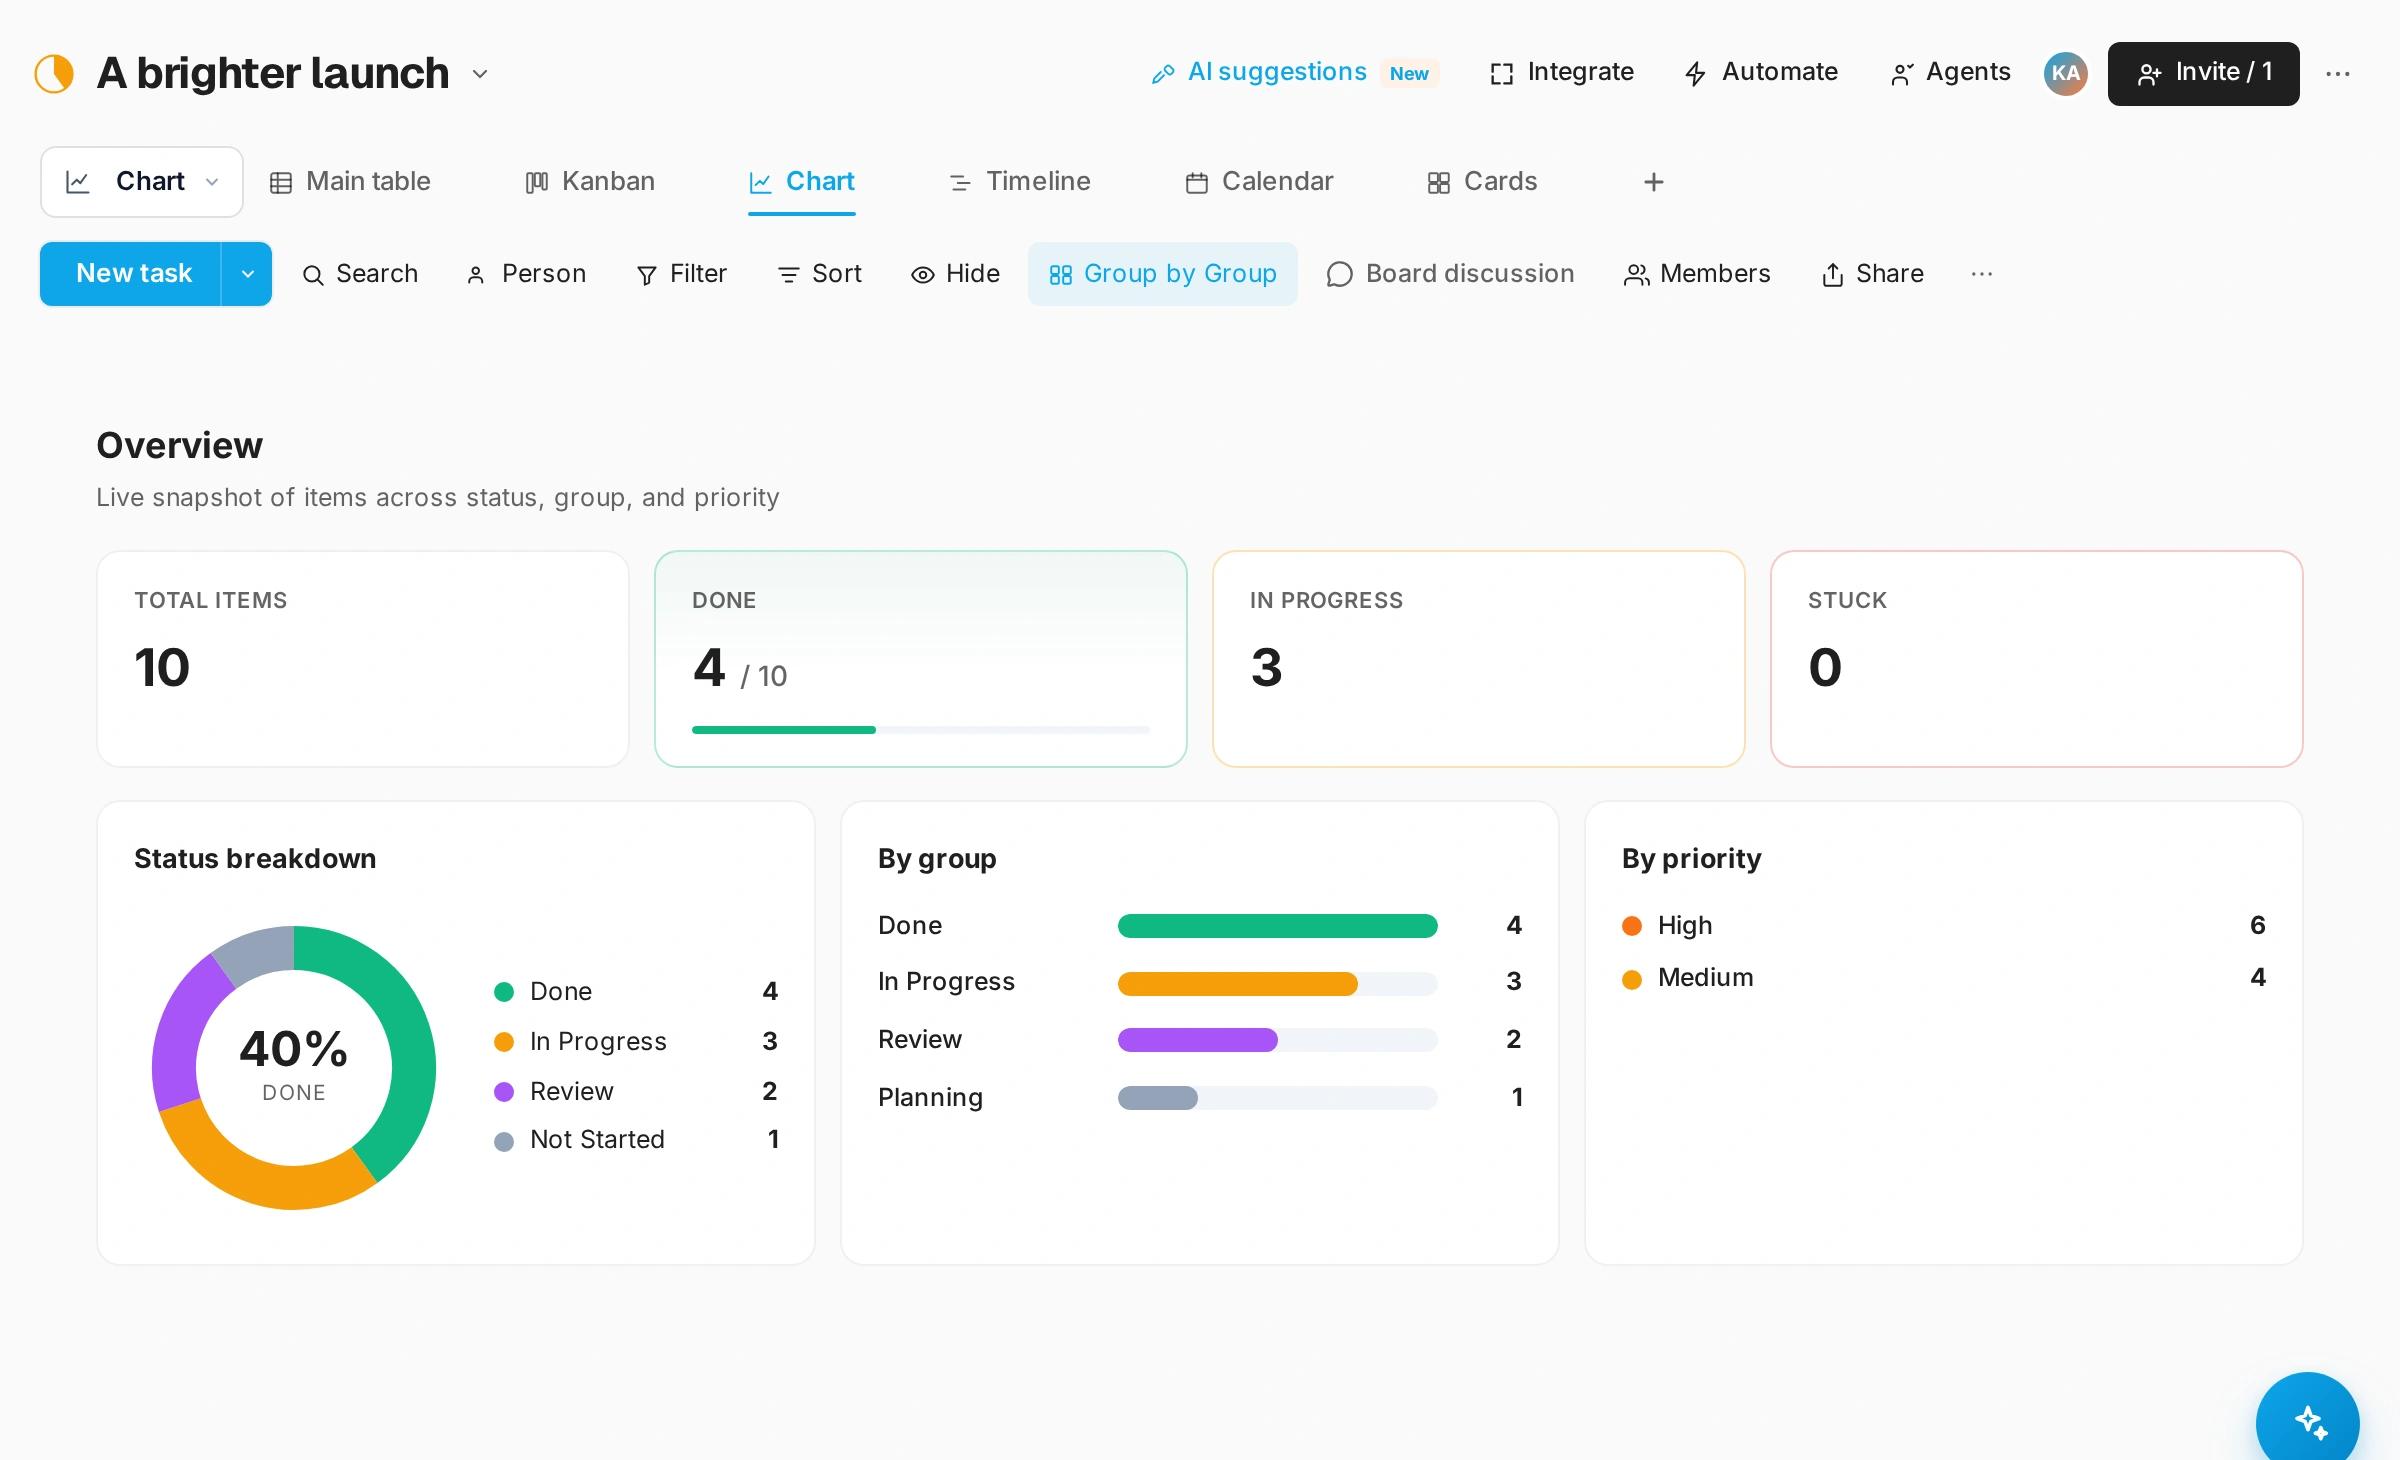
Give the next sprint a shape.
Organize sprint work, review the backlog and keep planned work visible. Connect the discussion about priorities to the tasks your team will actually take on.
Read the guide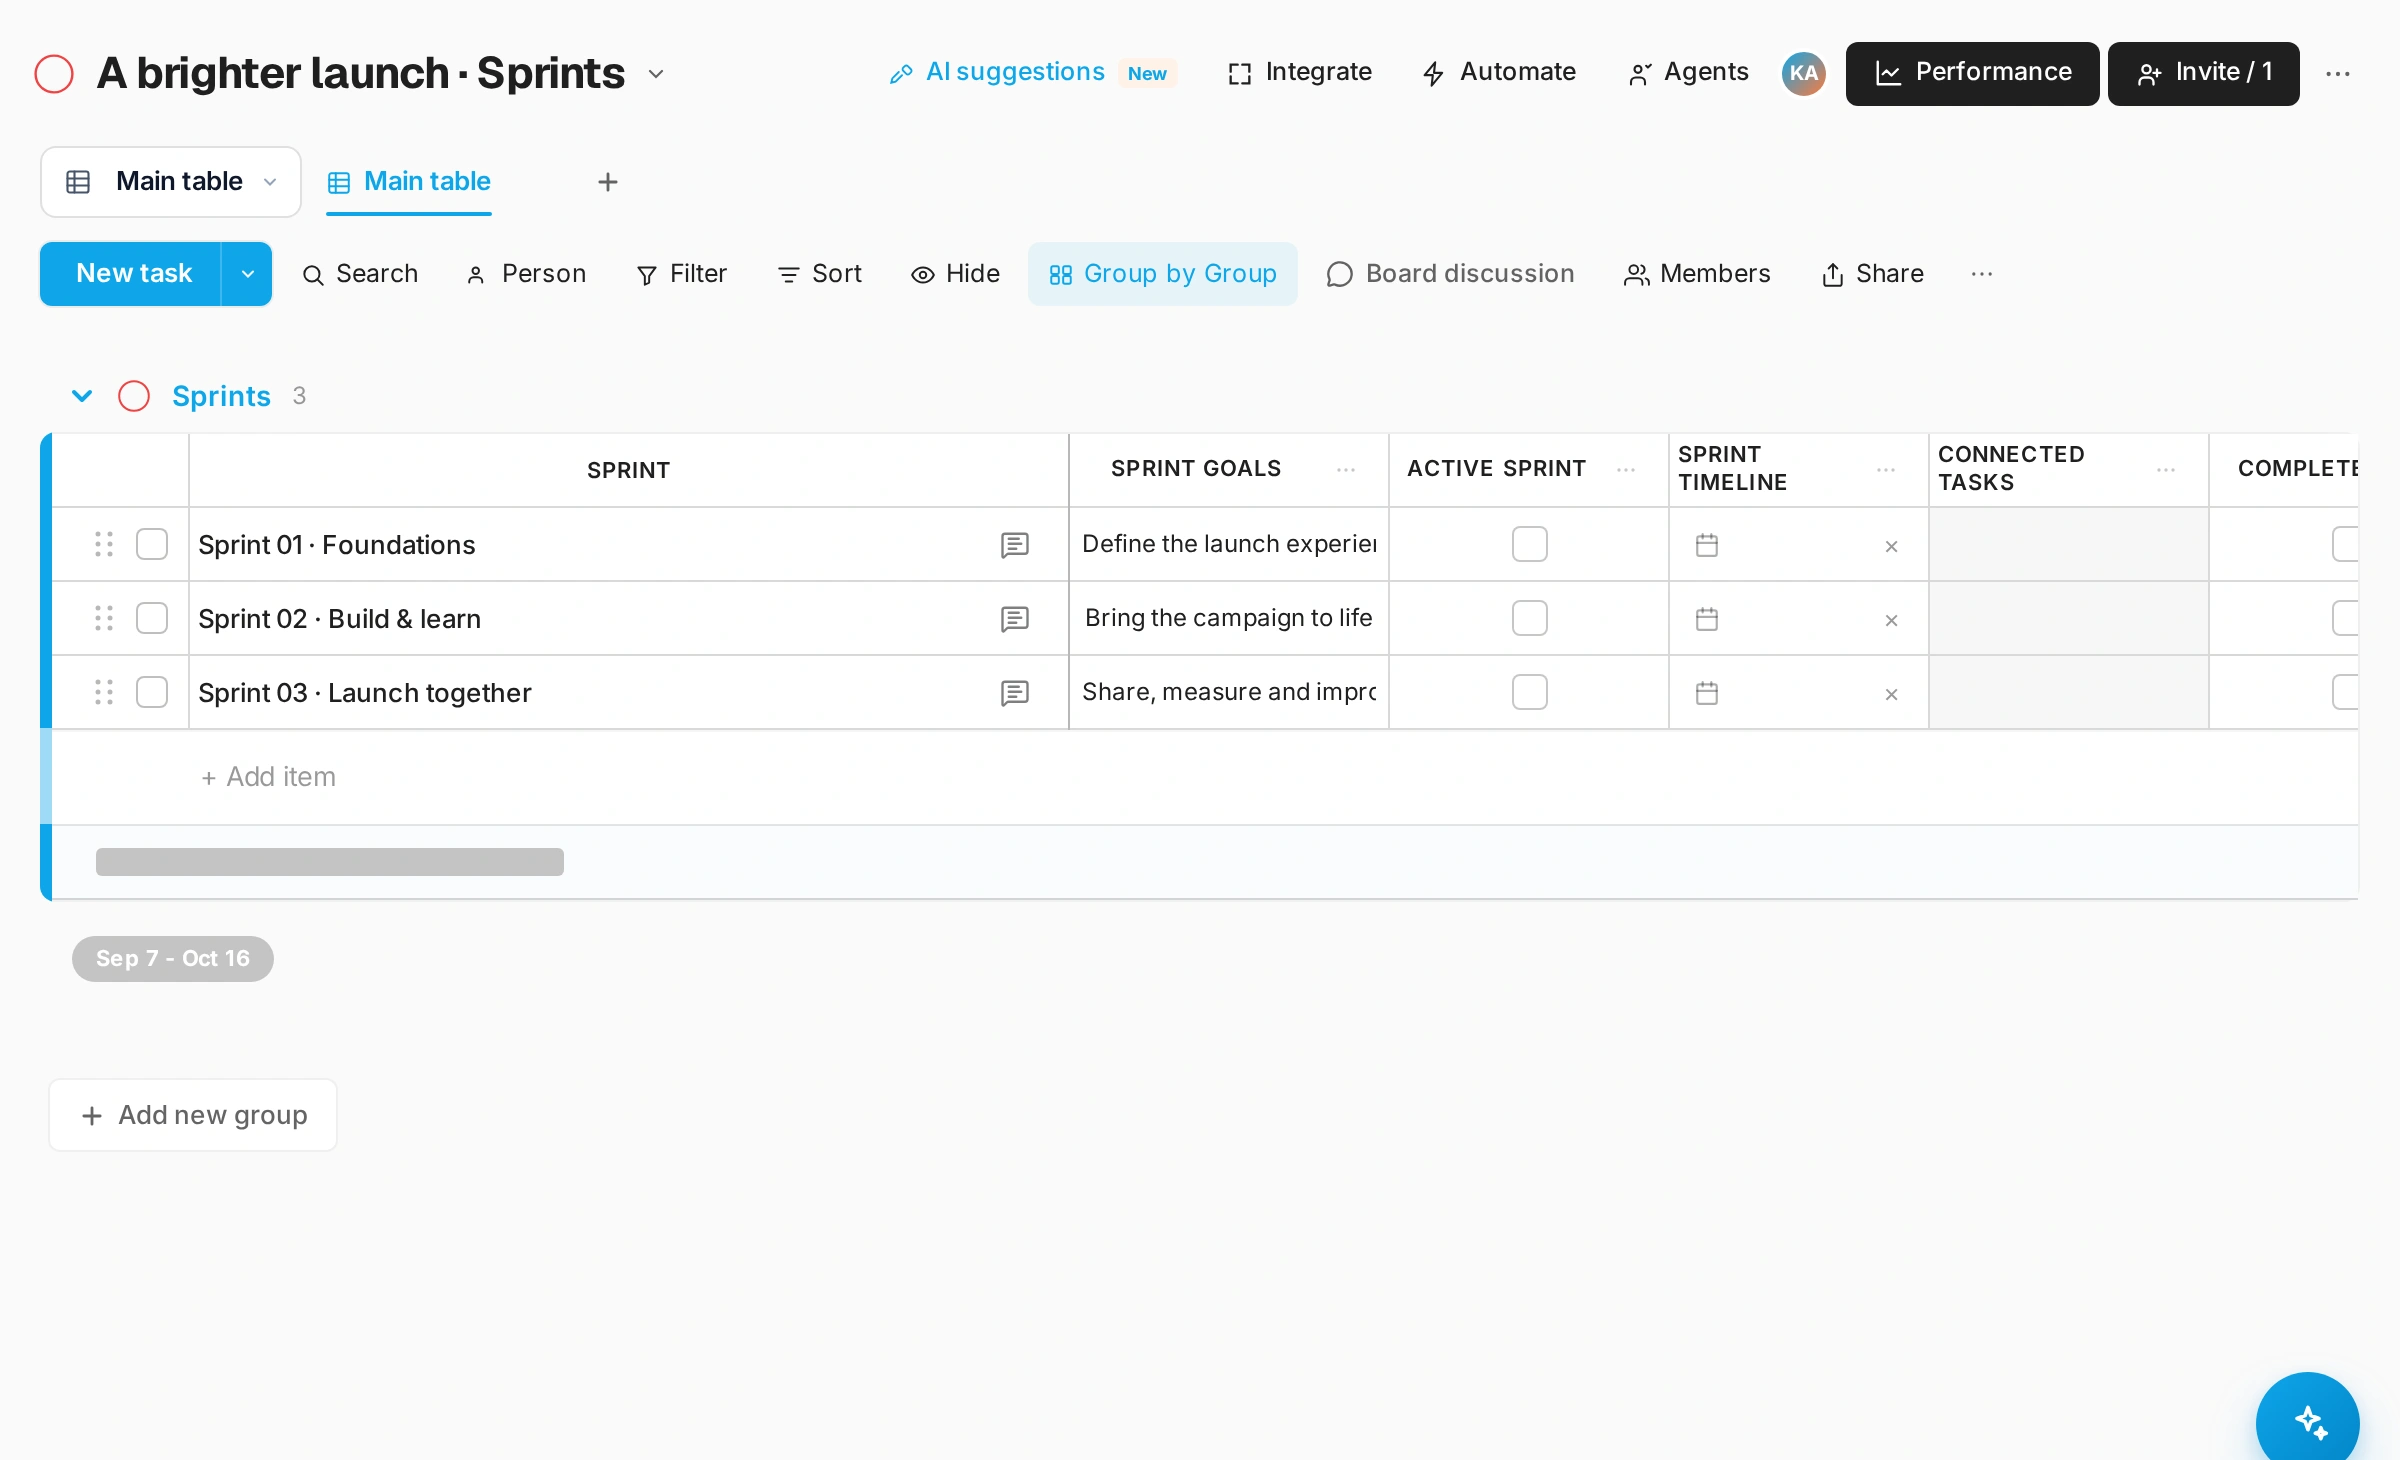
Read the context behind a number.
Dashboards help bring board information together. Check the underlying board, filters and ownership when a number needs explanation; the team’s shared data remains the source of context.
Read the guideGOOD QUESTIONS
A little clarity.
A confident start.
Are charts and dashboards the same?
No. Chart is a view of a board. Dashboards bring selected information together, while sprint planning supports the delivery cycle.
Why might a dashboard look empty?
Check that it has boards or widgets configured, that the boards contain relevant data and that your account can access them.